Real-time analysis
The Value of Analysis
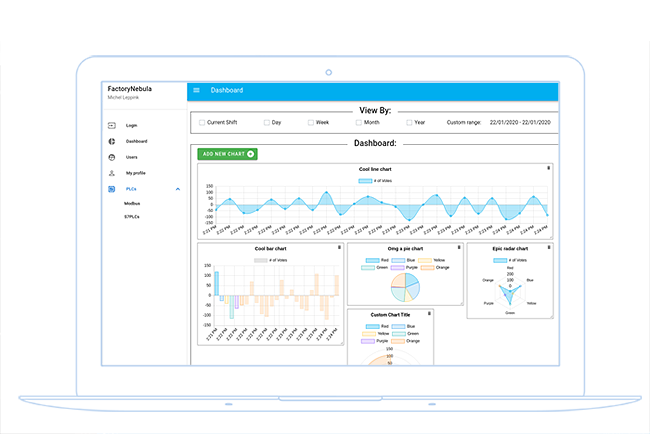
Data only truly means something once you’ve analyzed it. To make this easy for you, our software comes with its own dashboarding application. Creating your personalized dashboard in this application is easy as pie; simply select your datapoints and a chart type and you’re good to go. Select from multiple charttypes, apply math to your datapoints, and compare multiple datapoints in one chart – it’s all possible. Combine and analyse all your data in real time. Regardless of the original machine source, all data can be easily combined in one central dashboard.
Are you currently already using some other dashboarding service? That’s fine, we also support integration of external data analysis tools.