loader
banner
Dashboarding

ElasticSearch & Kibana Setup

There are many dashboarding tools out there that are compatible with our system. In this tutorial we’ll help you set up your Kibana Dashboarding.

Installing ElasticSearch

Step 1

Kibana is part of the ElasticSearch environment, so in order to use Kibana, we’ll first have to install ElasticSearch. Please follow the following guide for installation.

Installing Kibana

Step 2

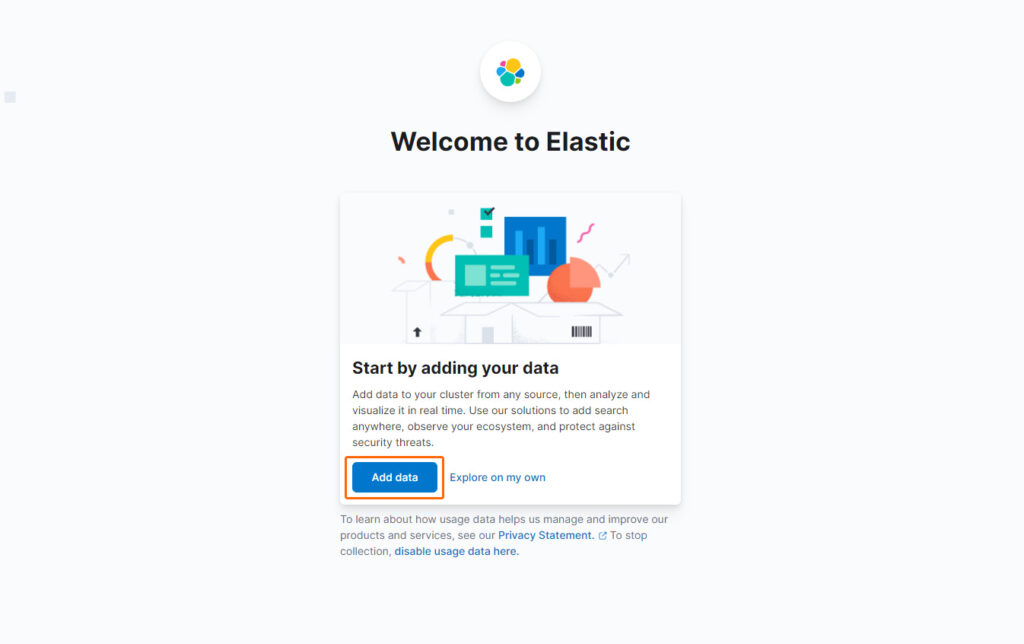
You can check if you’ve got ElasticSearch up and running using curl http://127.0.0.1:9200, or navigating to http://127.0.0.1:9200. If this gives a response, you can continue and install Kibana. Please follow the following guide for installation.

Launch Web Interface

Step 3

Once Kibana and ElasticSearch are both up and running, you can navigate to http://127.0.0.1:5601 in your web browser to access the interface. Here, click on ‘Add Data’ to ingest data into Kibana.

Ingest Data

Step 4

Here you’ll see a large list of data inputs that are supported by ElasticSearch. Select the database type you’d like to use (Such as Kafka Logs or PostGreSQL logs). Follow the steps mentioned on these pages and your ElasticSearch environment should start ingesting data.

All done

Step 5

Your ElasticSearch and Kibana environments are now receiving data! You can use Kibana to visualise this data on a dashboard. Check the following guide to get started with your dashbaording.